
Cricket is a data sport. Read it that way.
IND vs AUS — T20 Match 3
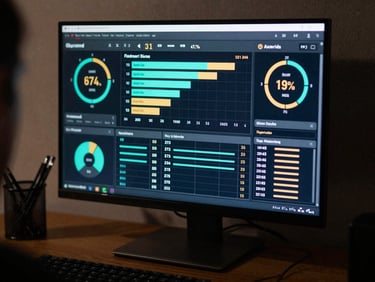
IND 187/4 (18.2 ov) — RR 10.18 · AUS need 61 off 22 balls. Kohli at crease: 74* (48).
Win probability model: IND 78.3% — momentum index up 14 pts last 3 overs.
Match centers, player form curves, and prediction models built for investors who already know how to read uncertainty. The same analytical discipline. Different field.
Match center. Not a scoreboard.
Ball-by-ball depth layer
Form curves, not averages
Optimal XI, risk-weighted
Rolling 10-match form index per player. Strike rate under pressure, powerplay contribution, death-over reliability — charted as trend lines, not career tables.
Captain and vice-captain picks ranked by expected value, not gut feel. Differential picks flagged. Same framework as portfolio position sizing — just a different asset.
Over-by-over run rate, pressure index, wicket probability — the same granularity serious operators use to read a match's turning point before it happens.


Rankings as momentum signals
ICC rankings visualized as 90-day trend curves. Teams gaining ground on a consistent slope before a major series — that's the pattern worth reading before the odds shift.
Venue advantage overlays, head-to-head condition splits, and batting-order depth scores surface the edges that raw rankings bury. The same move analysts run on sector rotation.

Uncertainty, quantified.
Match outcome probabilities updated ball-by-ball using Bayesian models. The same logic you apply to an earnings call — probabilities, not predictions. Angles, not tips.